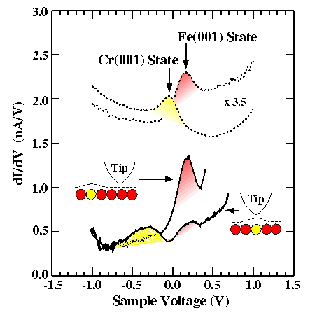
Experimental STM spectrum of a Cr impurity on the Fe (001). The spectrum changes on top of Cr atoms. The characteristic peak above the Fermi of the Fe (001) surface level becomes 2 peaks above and below the Fermi level. For comparison STM spectra for clean Fe(001) and Cr (001) surfaces are also shown.
Experiment from: A. Davis, J.A Stroscio, D.T. Pierce, R. Cellota, Phys. Rev. Lett. 76, 4175 (1996)

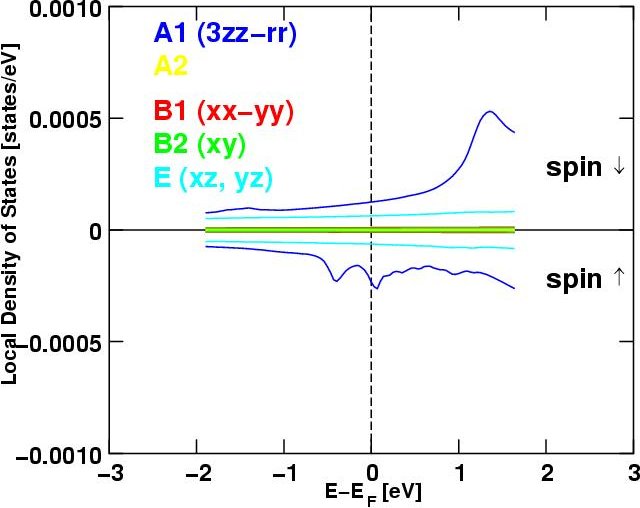
Theoretical KKR calculation of the STM spectra measured above. The symmetry decomposition of the states is shown. The peaks are due to minority electrons of dz2 symmetry.
From: N. Papanikolaou, B. Nonas, S. Heinze, R. Zeller, P.H. Dederichs, Phys. Rev. B 62, 11118 (2000)